
VAST 2021 Mini-Challenge 2
Project information
- Category: Data Visualization
- Project start date: January 2023
- Project end date: May 2023
Project Description
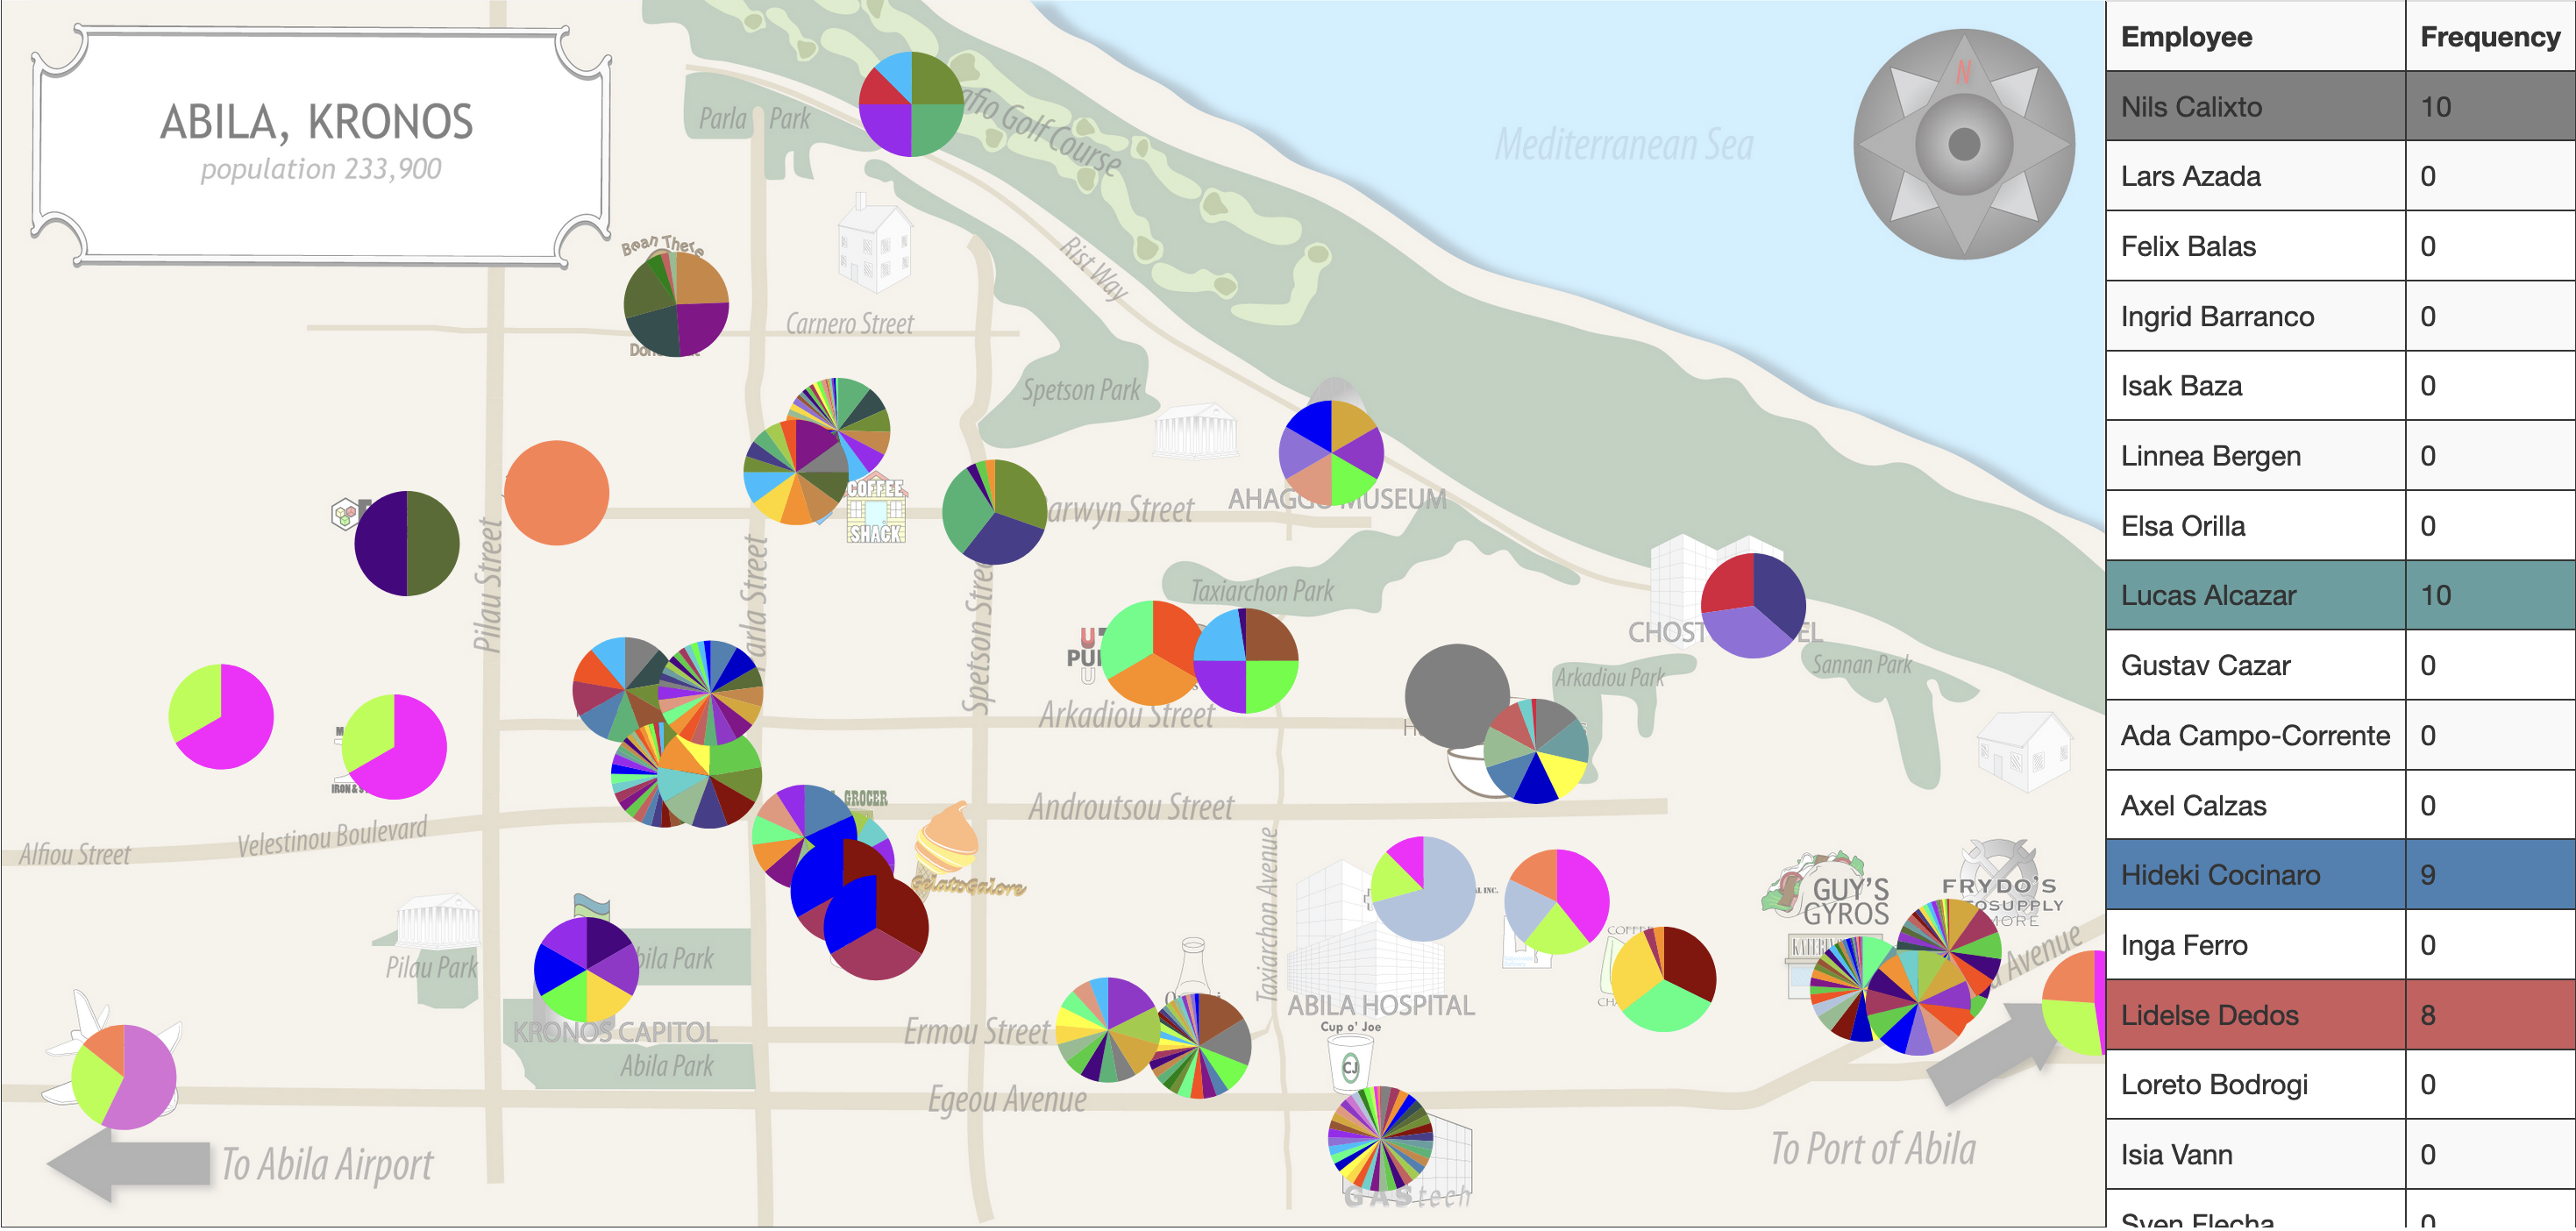
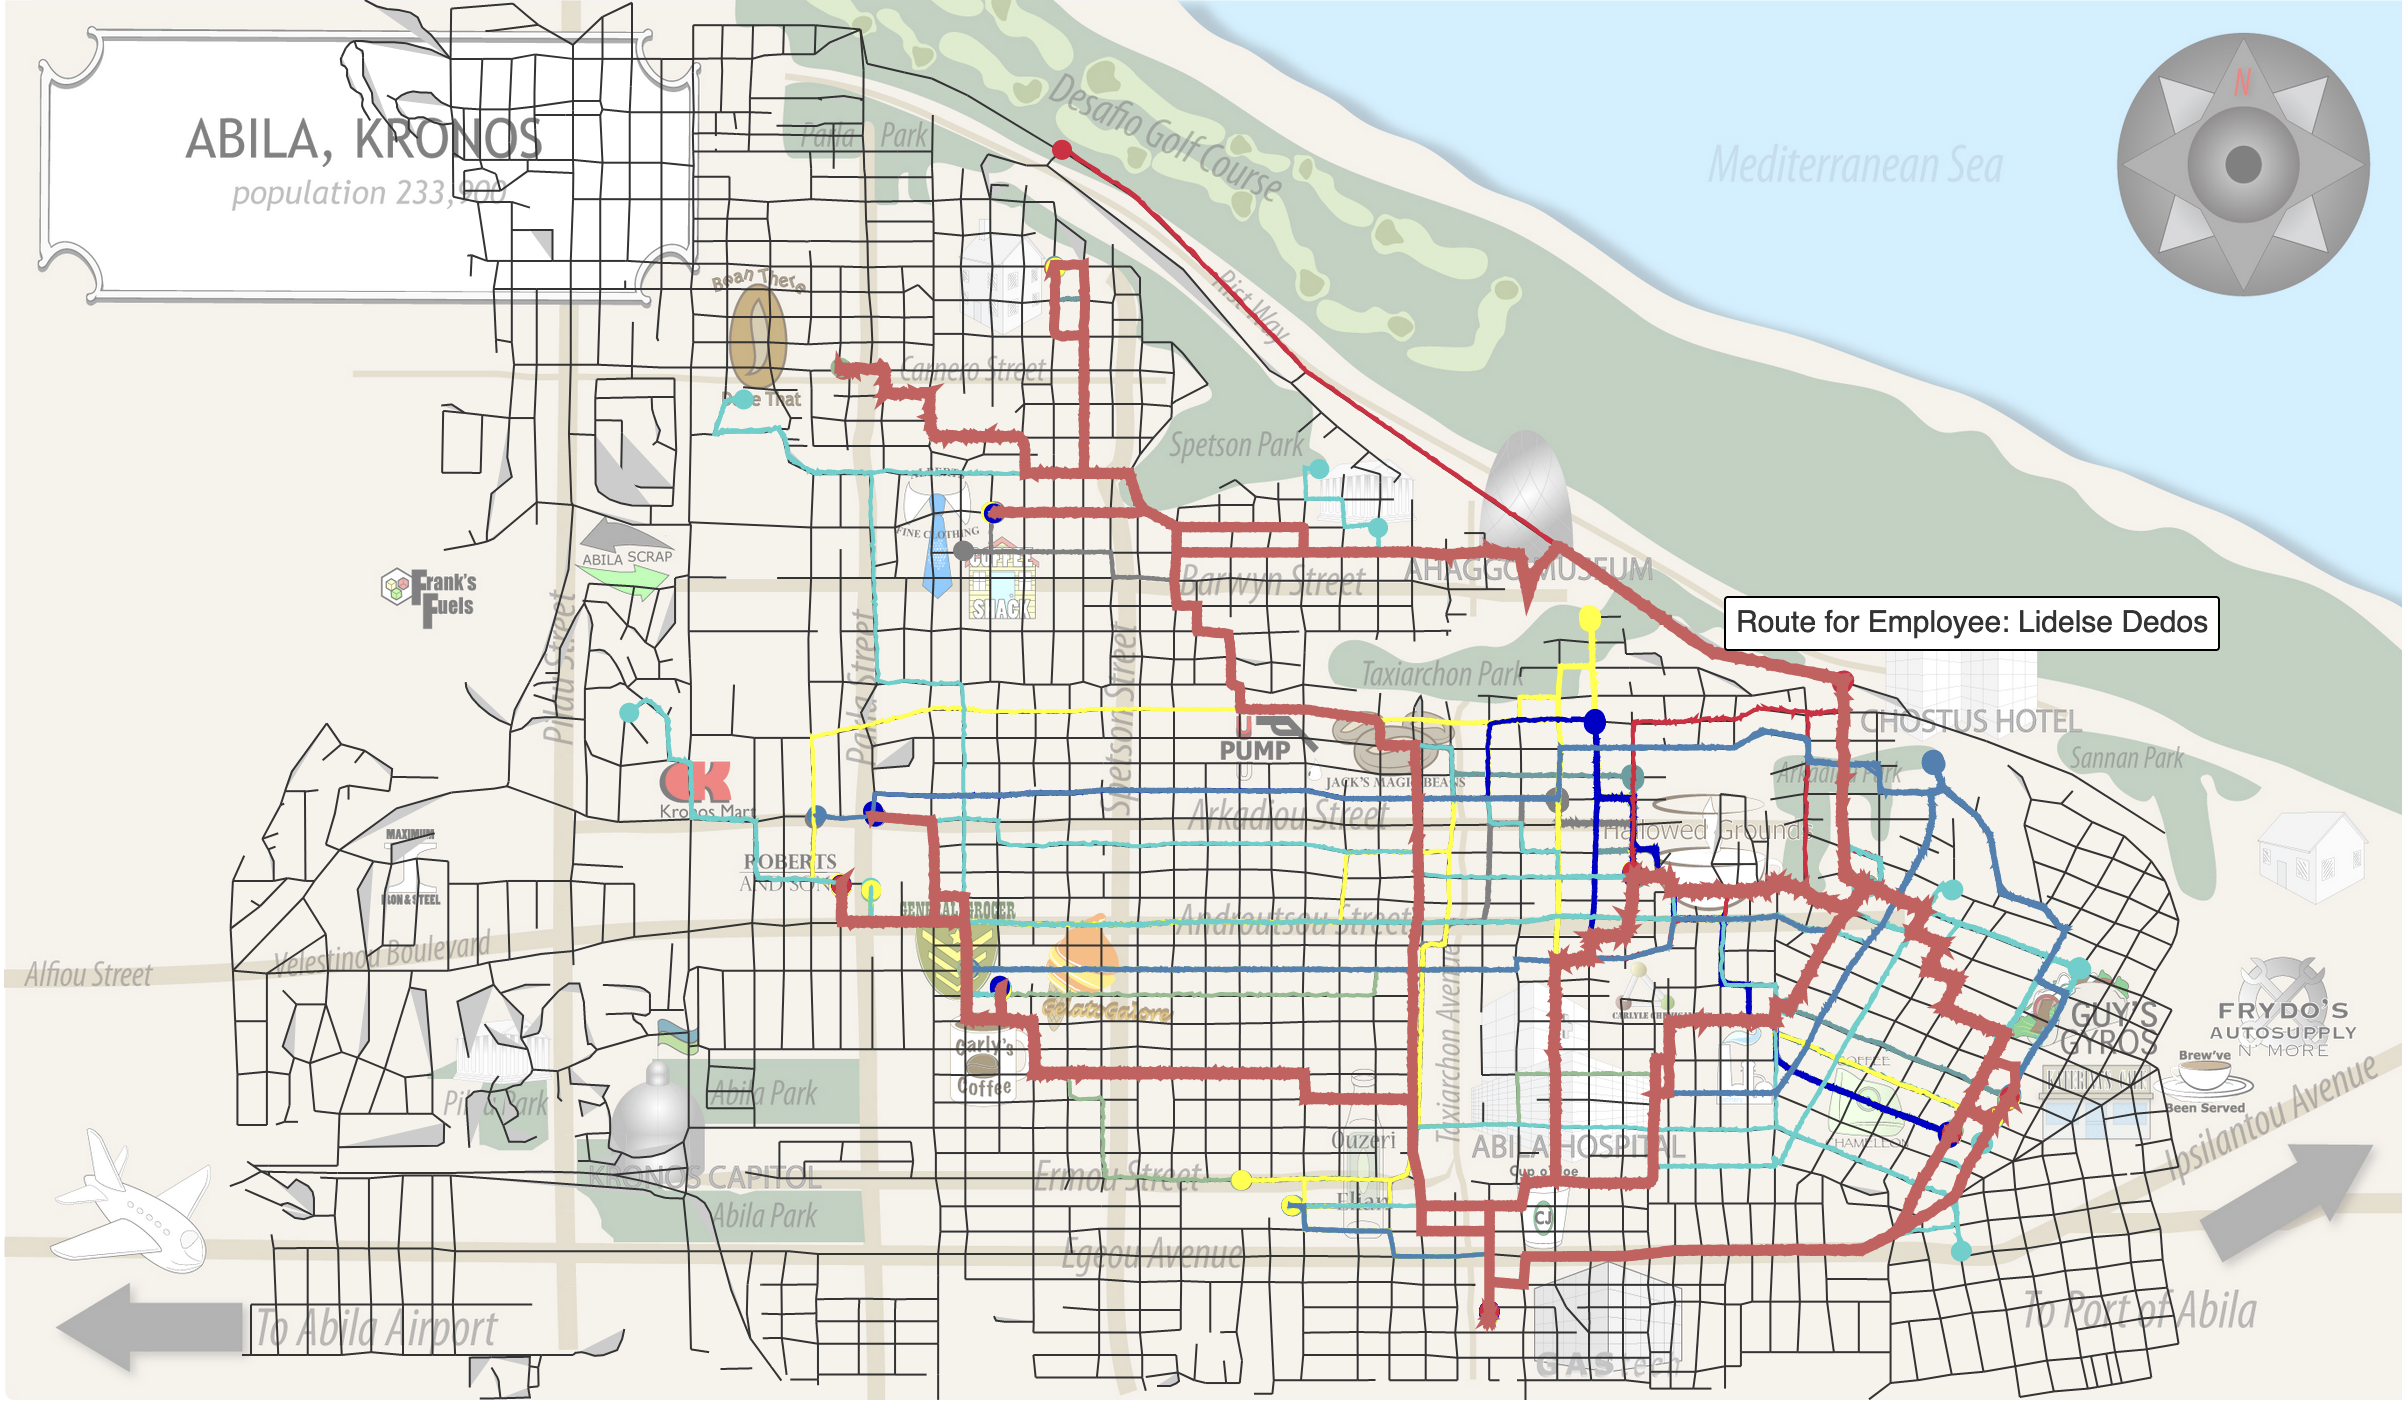
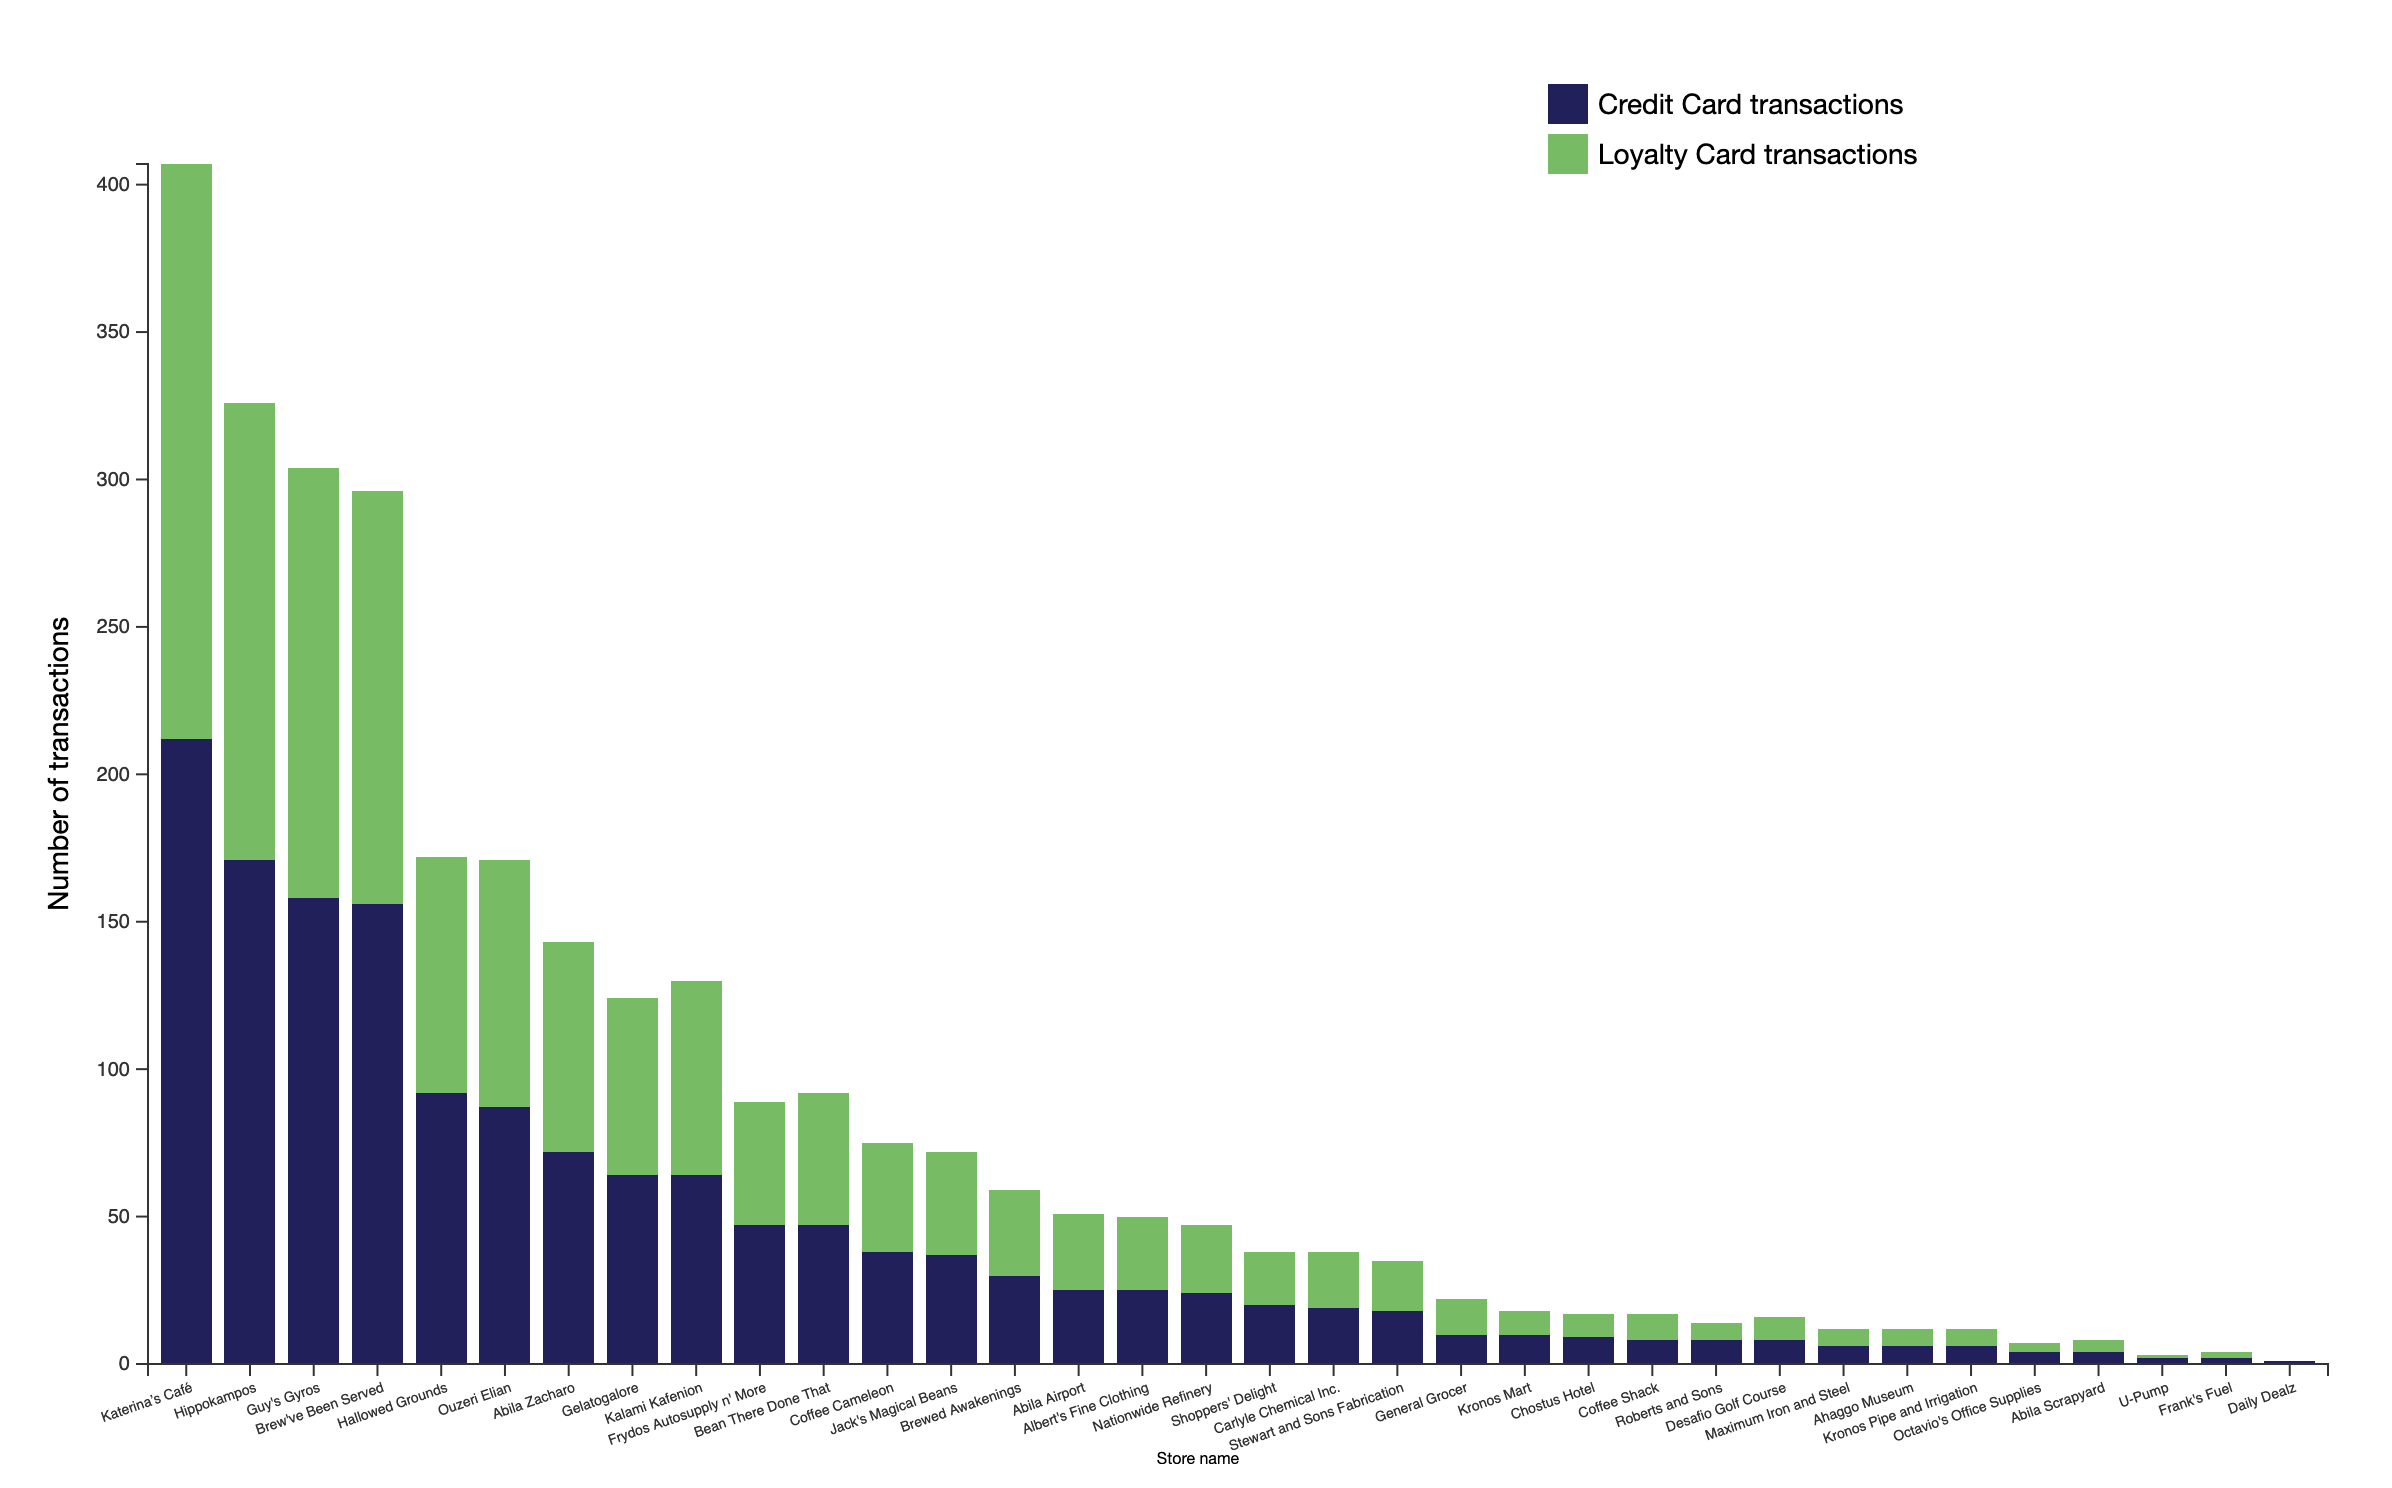
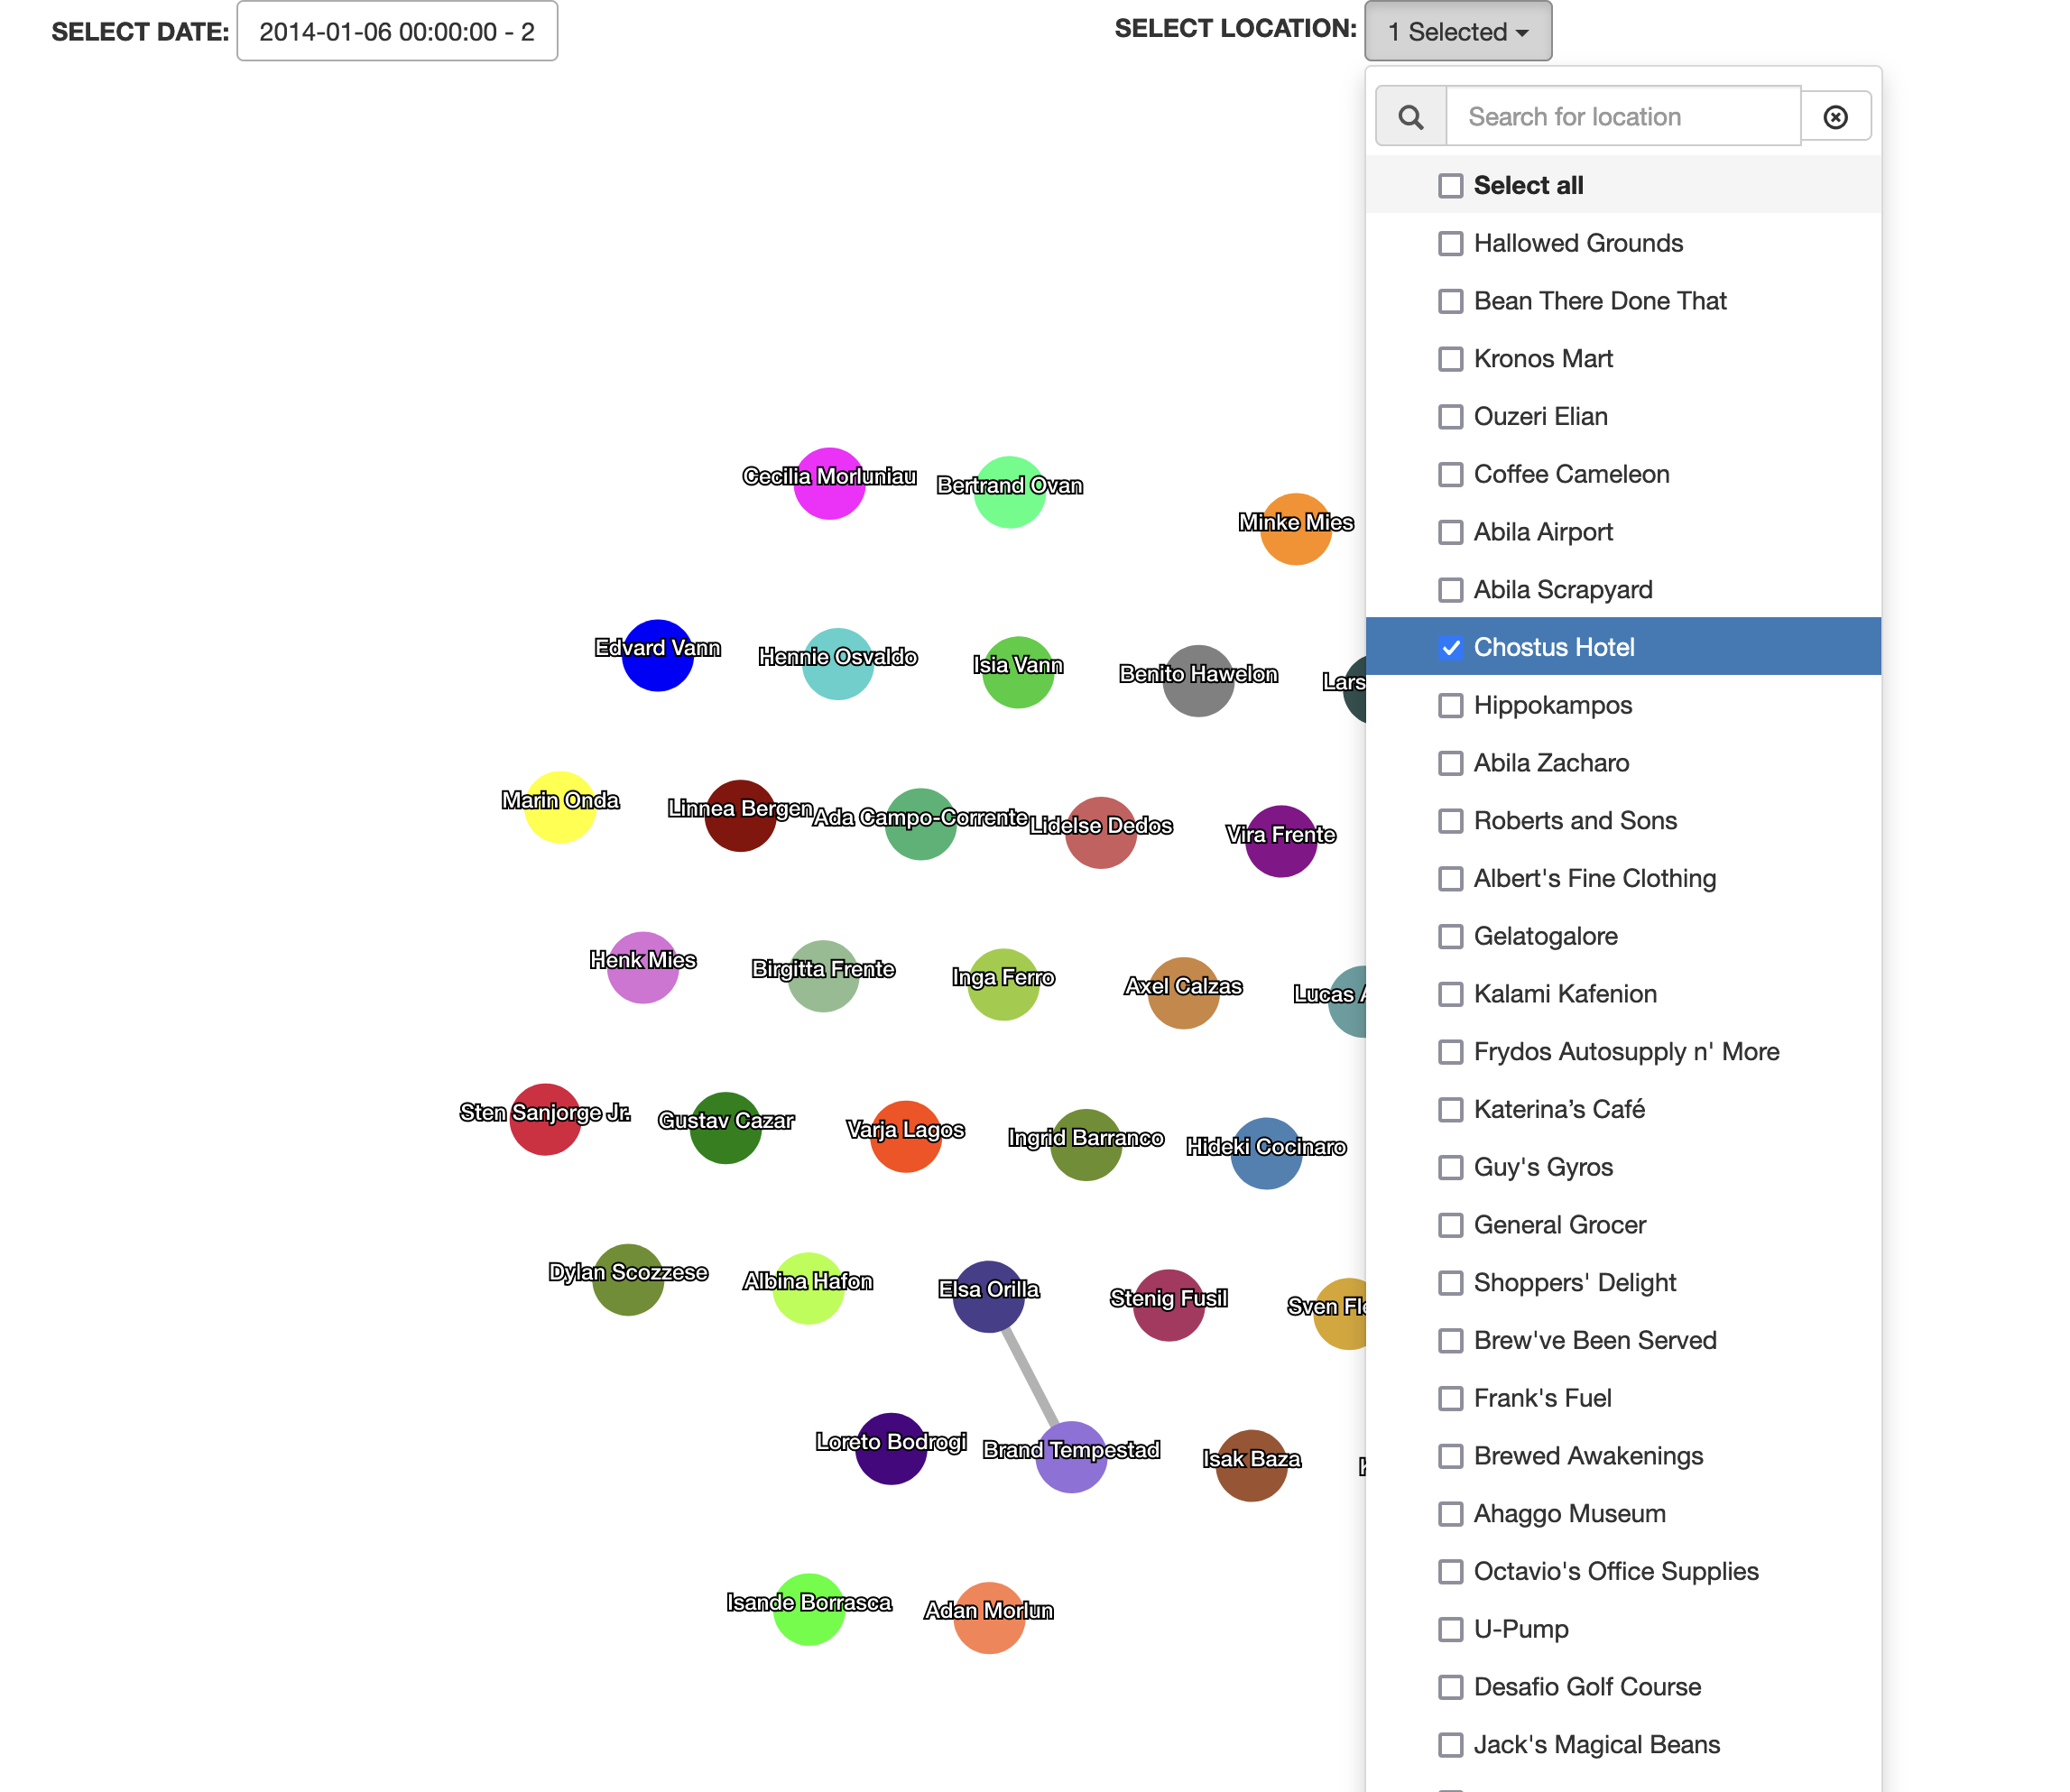
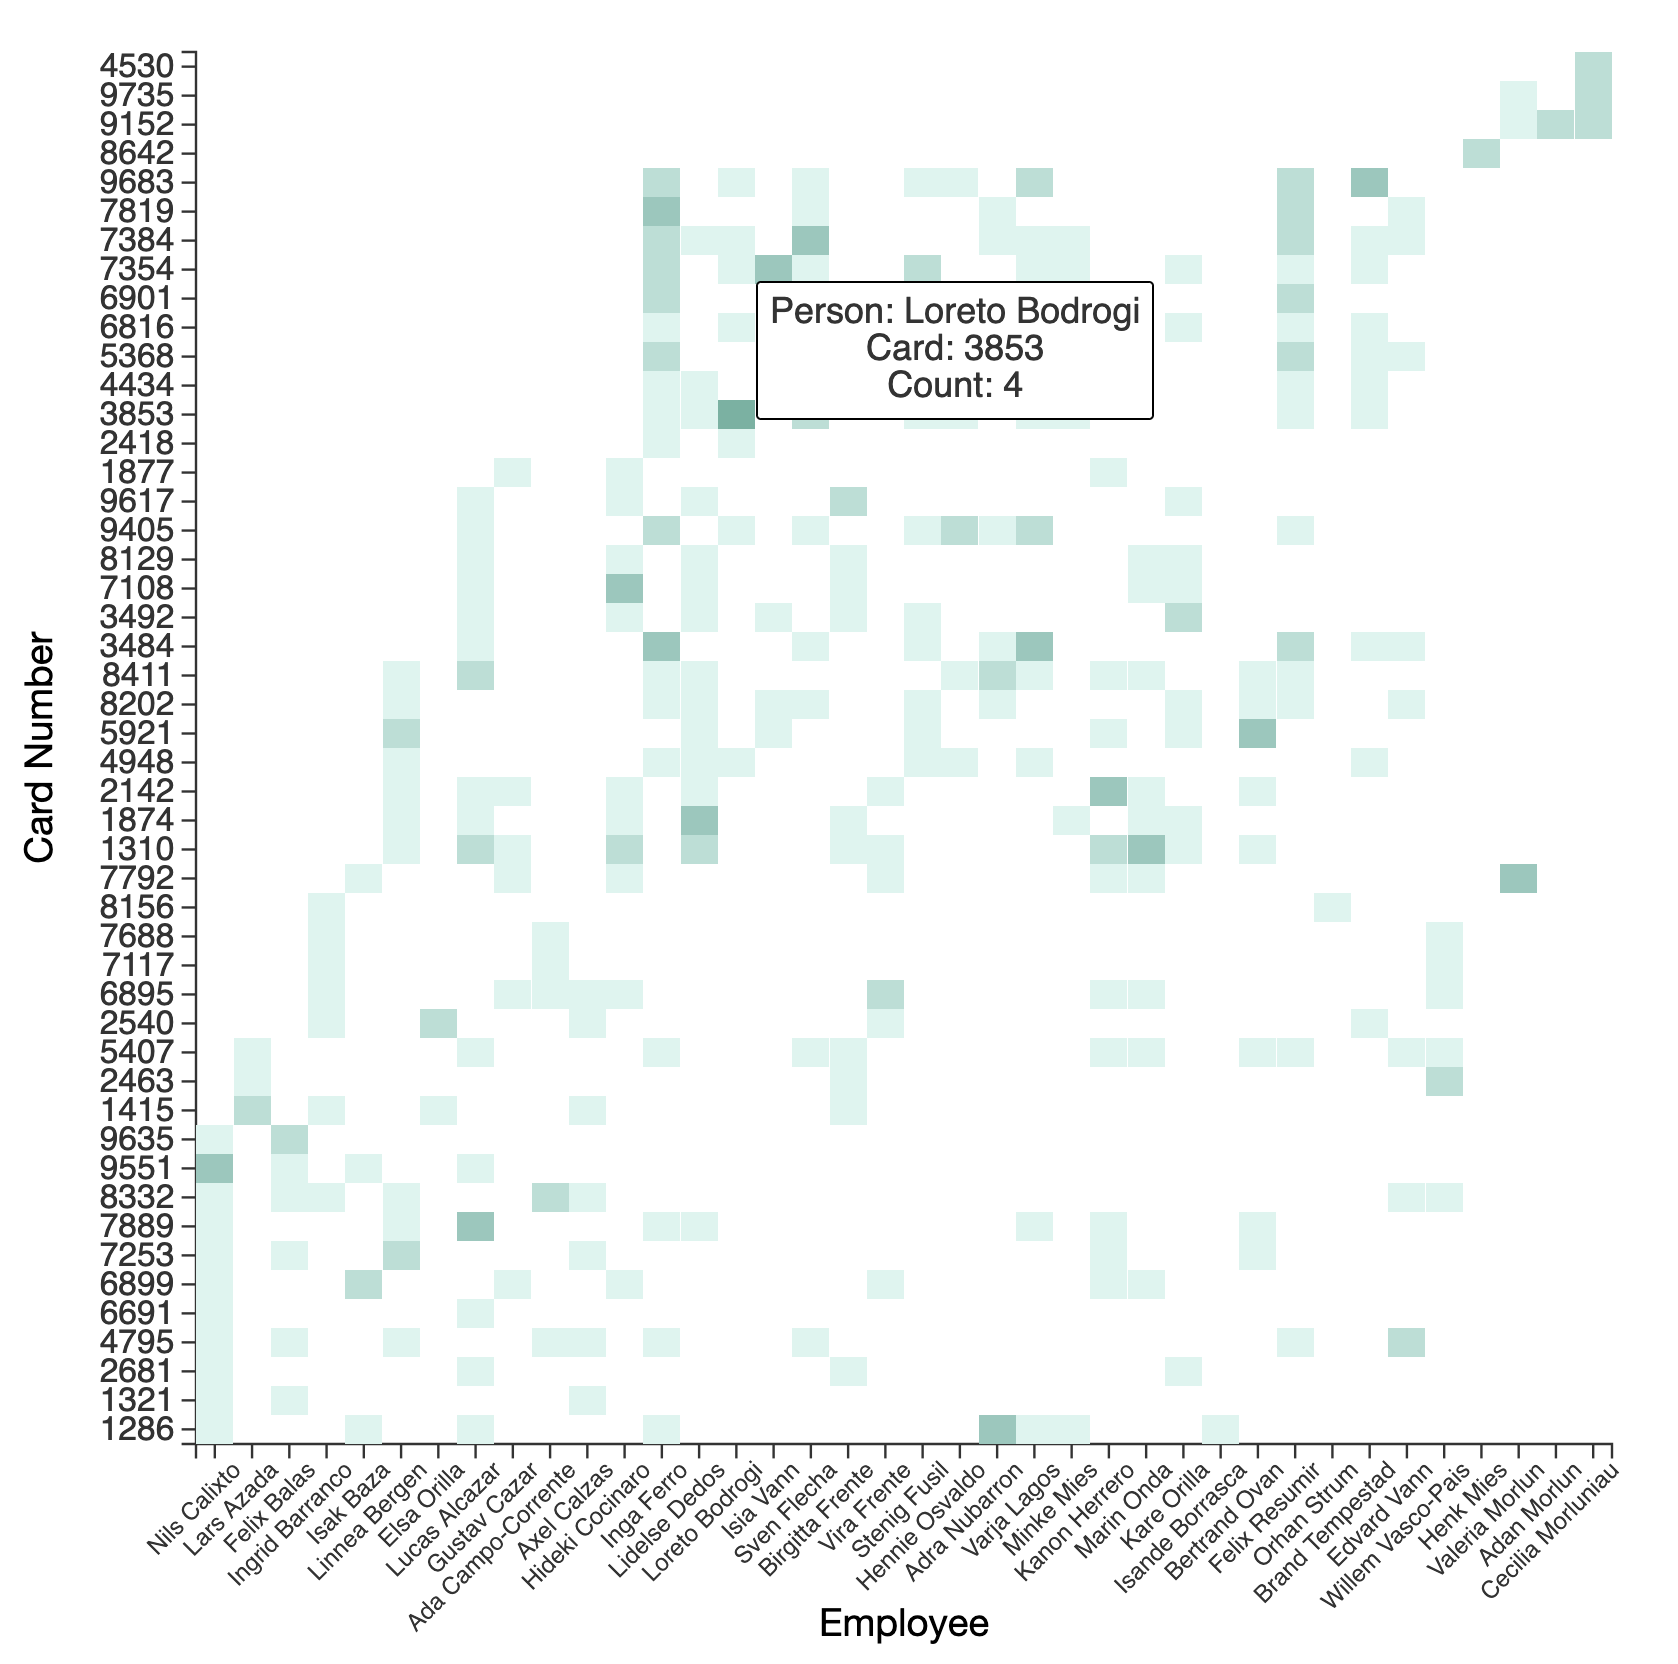
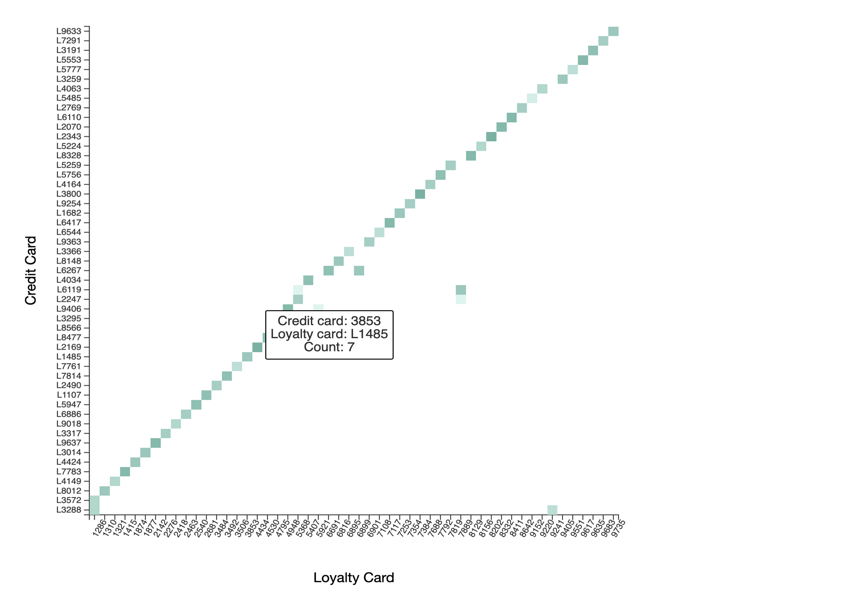
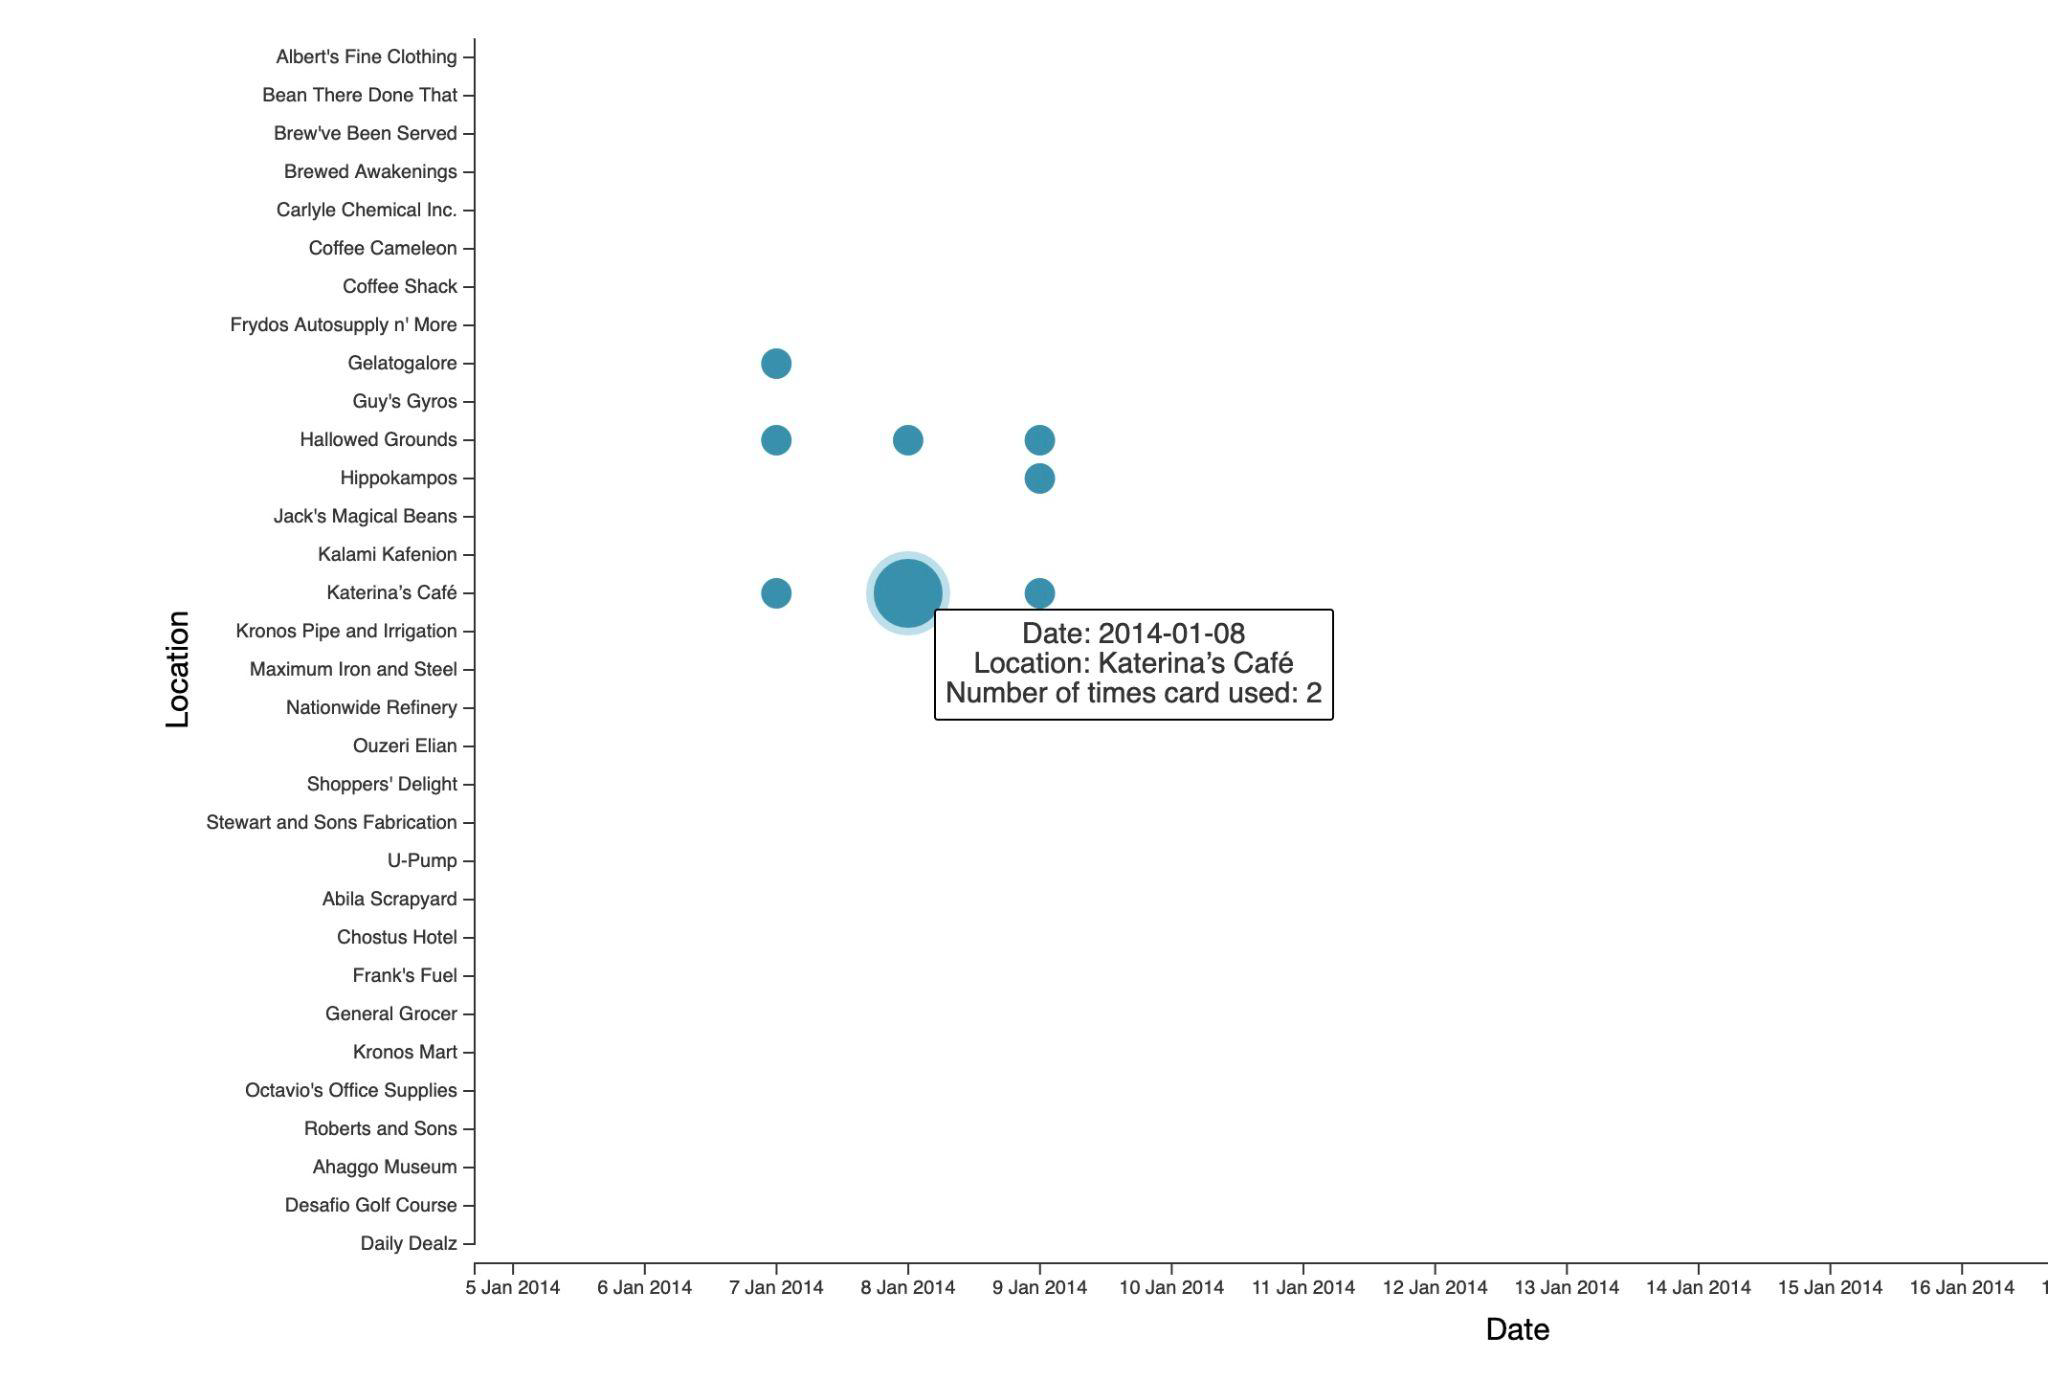
For the VAST Challenge 2021 Mini-Challenge 2, I focused on analyzing the disappearance of GAStech employees by leveraging geospatial and transaction data. My role involved creating a graphical analytics system that included seven visualizations designed to uncover patterns of suspicious behavior among employees. Using D3.js and Python Flask, I implemented features like a symbol map, stacked bar charts, and heat maps to visualize movement and transaction data effectively. I also optimized data processing to enhance responsiveness, ensuring that complex queries could be addressed efficiently. This project not only honed my skills in data visualization but also deepened my understanding of geospatial analysis and its practical applications in real-world scenarios.